USGS - science for a changing world

New Mexico Water Science Center
Home iconhome Info iconinformation/data Projects iconprojects Publications iconpublications Drought icondrought Flood iconflood NAWQA iconNAWQA Contact iconcontact [an error occurred while processing this directive]   internal
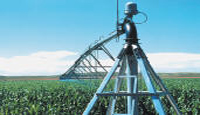
An irrigation system.

DATA CENTER

[an error occurred while processing this directive]

Water Use in New Mexico

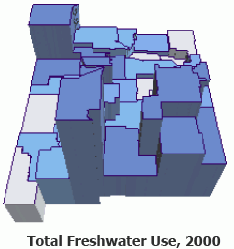
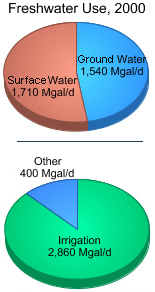
Map showing total freshwater use by county, year 2000. Pie chart showing surface- and ground-water freshwater use and irrigation use, 2000.

The future health and welfare of the Nation's population is dependent upon a continuing supply of uncontaminated fresh water. Increasing withdrawals and increasing demands for instream flows are limiting the water available for future use. More comprehensive water-use data and analysis of water-use information are needed to quantify the stress on existing supplies and to better model and evaluate possible water-supply management options to supplement traditional water-supply approaches.

The USGS compiles water-use data from numerous sources for all parts of the county, and since 1950 has published a series of Circulars on the estimated use of water in the United States at 5-year intervals. These Circulars contain State-level estimates of the amount of public- and self-supplied water used for commercial, domestic, industrial, irrigation, livestock, mining, power generation, and other purposes. The water-use data collected and compiled in New Mexico are an integral part of the nationwide assessment of water supply and demand.

Freshwater Use in New Mexico, 2000

Water use in New Mexico, 2000
(Water-use values are in million gallons per day (Mgal/d)
Population is in thousands)
CountyPopulationGround-water useSurface-water useTotal
Bernalillo556.68114.6755.37170.04
Catron3.540.6517.5218.17
Chaves61.38297.4621.58319.04
Cibola25.604.183.898.07
Colfax14.191.6045.4147.01
Curry45.04182.720.00182.72
De Baca2.249.1835.4044.58
Dona Ana174.68124.21369.53493.74
Eddy51.66125.0993.62218.71
Grant31.008.2623.1731.43
Guadalupe4.681.8811.3313.21
Harding0.813.360.003.36
Hidalgo5.9330.597.8138.40
Lea55.51137.450.00137.45
Lincoln19.418.3917.0425.43
Los Alamos18.344.110.004.11
Luna25.0286.473.4289.89
McKinley74.8011.942.2614.20
Mora5.180.6229.1429.76
Otero62.3027.3314.8642.19
Quay10.167.9196.40104.31
Rio Arriba41.194.5099.40103.90
Roosevelt18.02137.070.00137.07
Sandoval89.9117.4255.0772.49
San Juan113.801.49261.15262.64
San Miguel30.131.1945.0546.24
Santa Fe129.2927.9318.2846.21
Sierra13.2711.9321.3233.25
Socorro18.0832.65128.16160.81
Taos29.985.0187.1192.12
Torrance16.9131.760.0031.76
Union4.1769.575.7075.27
Valencia66.1514.71144.56159.27
Total1,819.051,543.301,713.553,256.85

Information Resources

[an error occurred while processing this directive]

Accessibility FOIA Privacy Policies and Notices

Take Pride in America logo USA.gov logo U.S. Department of the Interior | U.S. Geological Survey
URL: http://nm.water.usgs.gov/infodata/wateruse.html
Page Contact Information: webmaster@nm.water.usgs.gov
Page Last Modified: Wednesday, 28-Dec-2016 15:06:54 EST